Understanding Insights
Last updated: October 14, 2025
Overview
To help with reporting and trend identification, NodaFi has the Insights feature. Insights allow you to dive into the data of your tickets. Using insights you’ll see preconfigured charts and graphs that allow you to quickly identify trends.
You can filter data and even export information as PDFs or CSV files for further analysis.
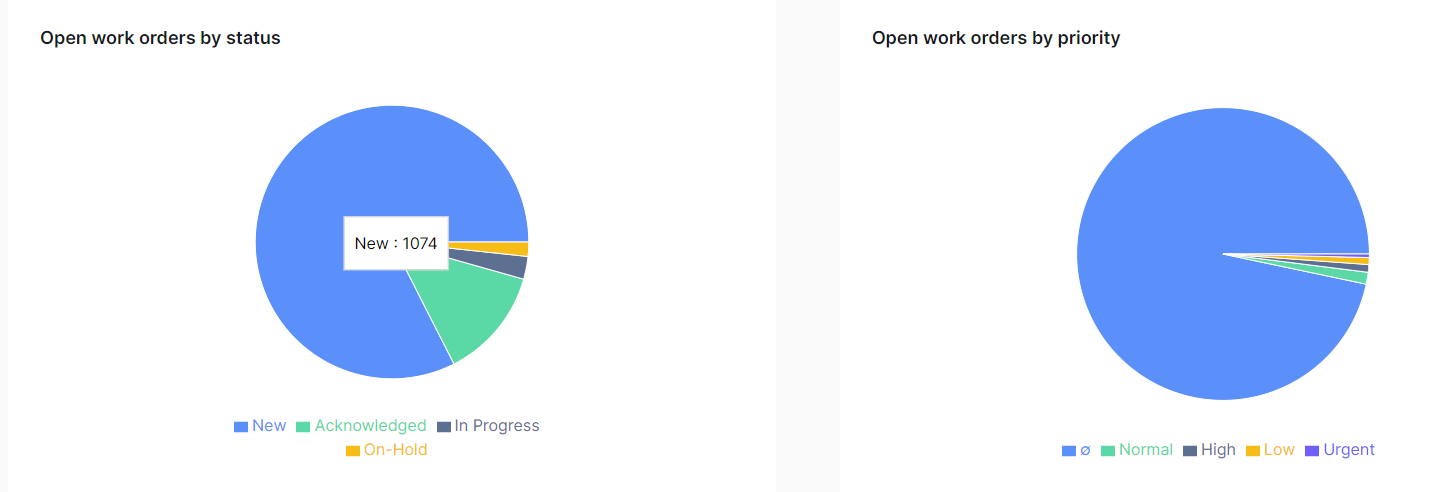
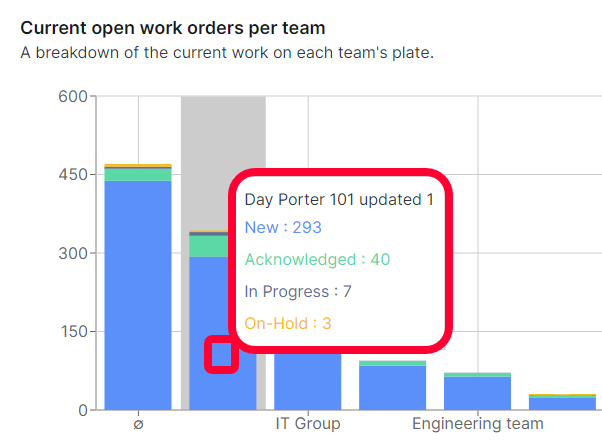
You can hover over an insight graph to see details about the data.
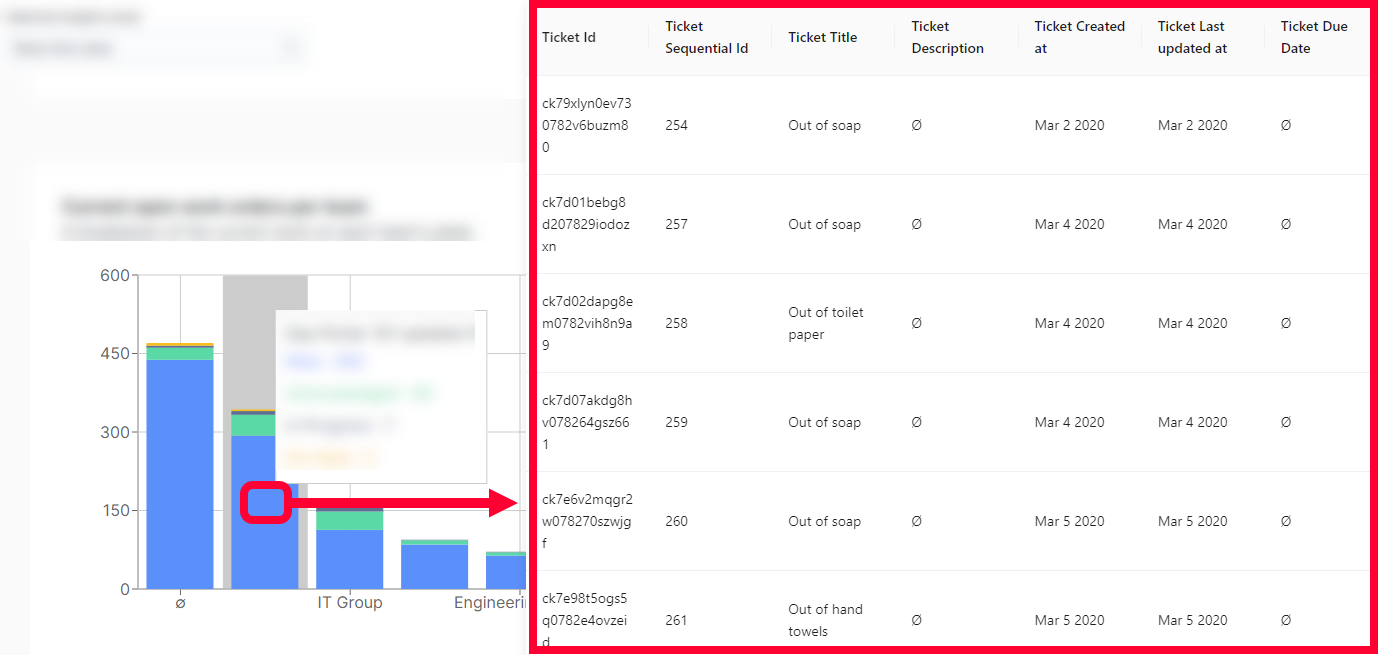
Click on a graph to open a window with a table of the data.
There are two modes for insights in NodaFi, Real-time data and Historical data. Both can be found on the Insights page by clicking Insight in the left menu.
We’ll go over both below.
Real-time Data
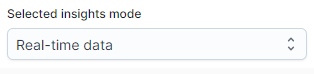
This mode shows you data for tickets that are currently open and active in your system. In the top left, use the Selected insights mode dropdown to choose this mode.
Historical Data
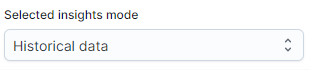
This mode allows you to see snapshots of previous data for selected periods. In the top left, use the Selected insights mode dropdown to choose this mode.
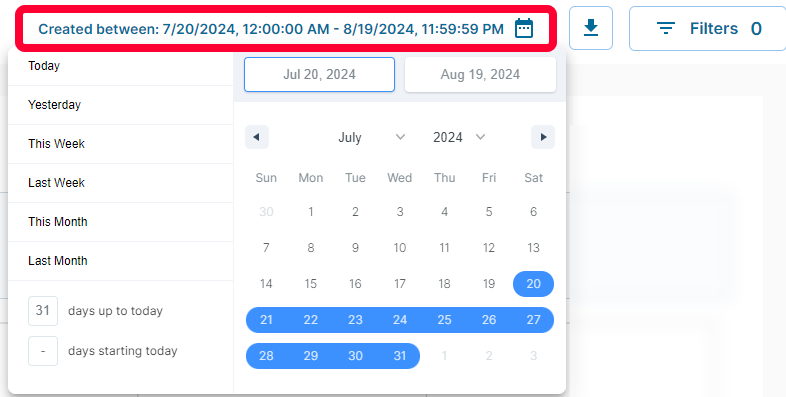
Make sure to click the Created between button in the top right to select a period of time for the data.
Learn More
To learn more about using insights, see the articles below: